Client:
Various
Project Summary:
Commissioned data visualization projects (some editorial, others B2B).

Editorial illustration: As people age and the valves inside their veins lose efficacy, mini-pumps made from the patients’ own heart cells could keep the blood flowing and ward off a slate of common health conditions
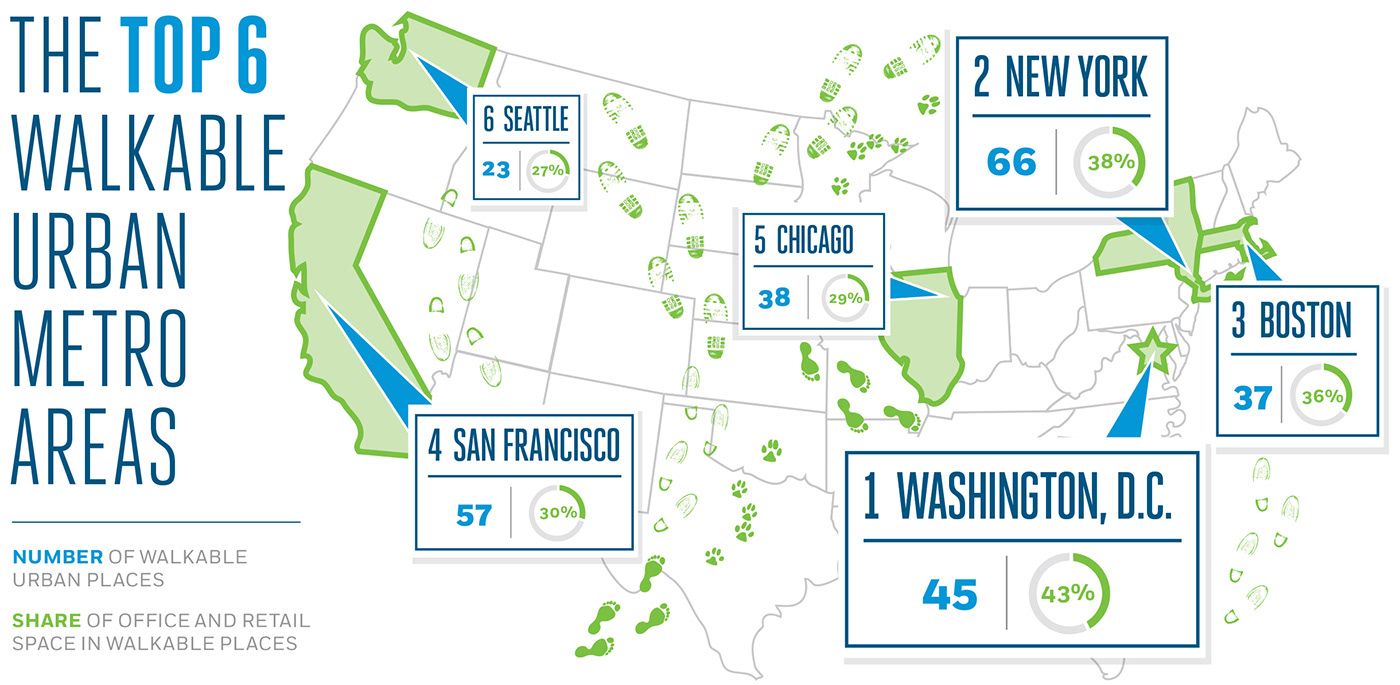
Editorial illustration: General summary of a study of the urban areas with the most walkable amenities in the U.S. where Washington, D.C. ranked first

Survey results from a conference for the US agriculture industry.

Editorial illustration: Approximate timeline of the Rosetta satellite flightpath.

Neighborhood cohort designations overlaid campus boundaries map.

The U.S. skilled labor market by the numbers.

A comparative size chart of the recently discovered "Highland Monster" with known dinosaurs.
Summer 2018 issue open art for story on alumni who retired from MLB to call games for the NY Yankees


