114th United States Congress vs National Demographics. Final version with some earlier WIP.
With election day 2016, I took a look at how well represented we are as a nation in terms of demographics. This Congress has been touted as the most diverse yet, but naturally there’s a long way to go. Personally, I don’t think that a congressman has to be your exact demographic in order to represent; however, discussions with people concerning minority issues, I’ve noticed how much it helps to have some minority status in order to have sympathy for those issues. In my own state, I’m part of most majorities—white, male, Mormon and conservative backgrounds, but have some minority identities—gay, single, inactive Mormon, independent to liberal politics, that I’ll find it frustrating that any laws to accommodate more groups are usually met with “things are just fine the way they are” by government and community members who check all the majority boxes.
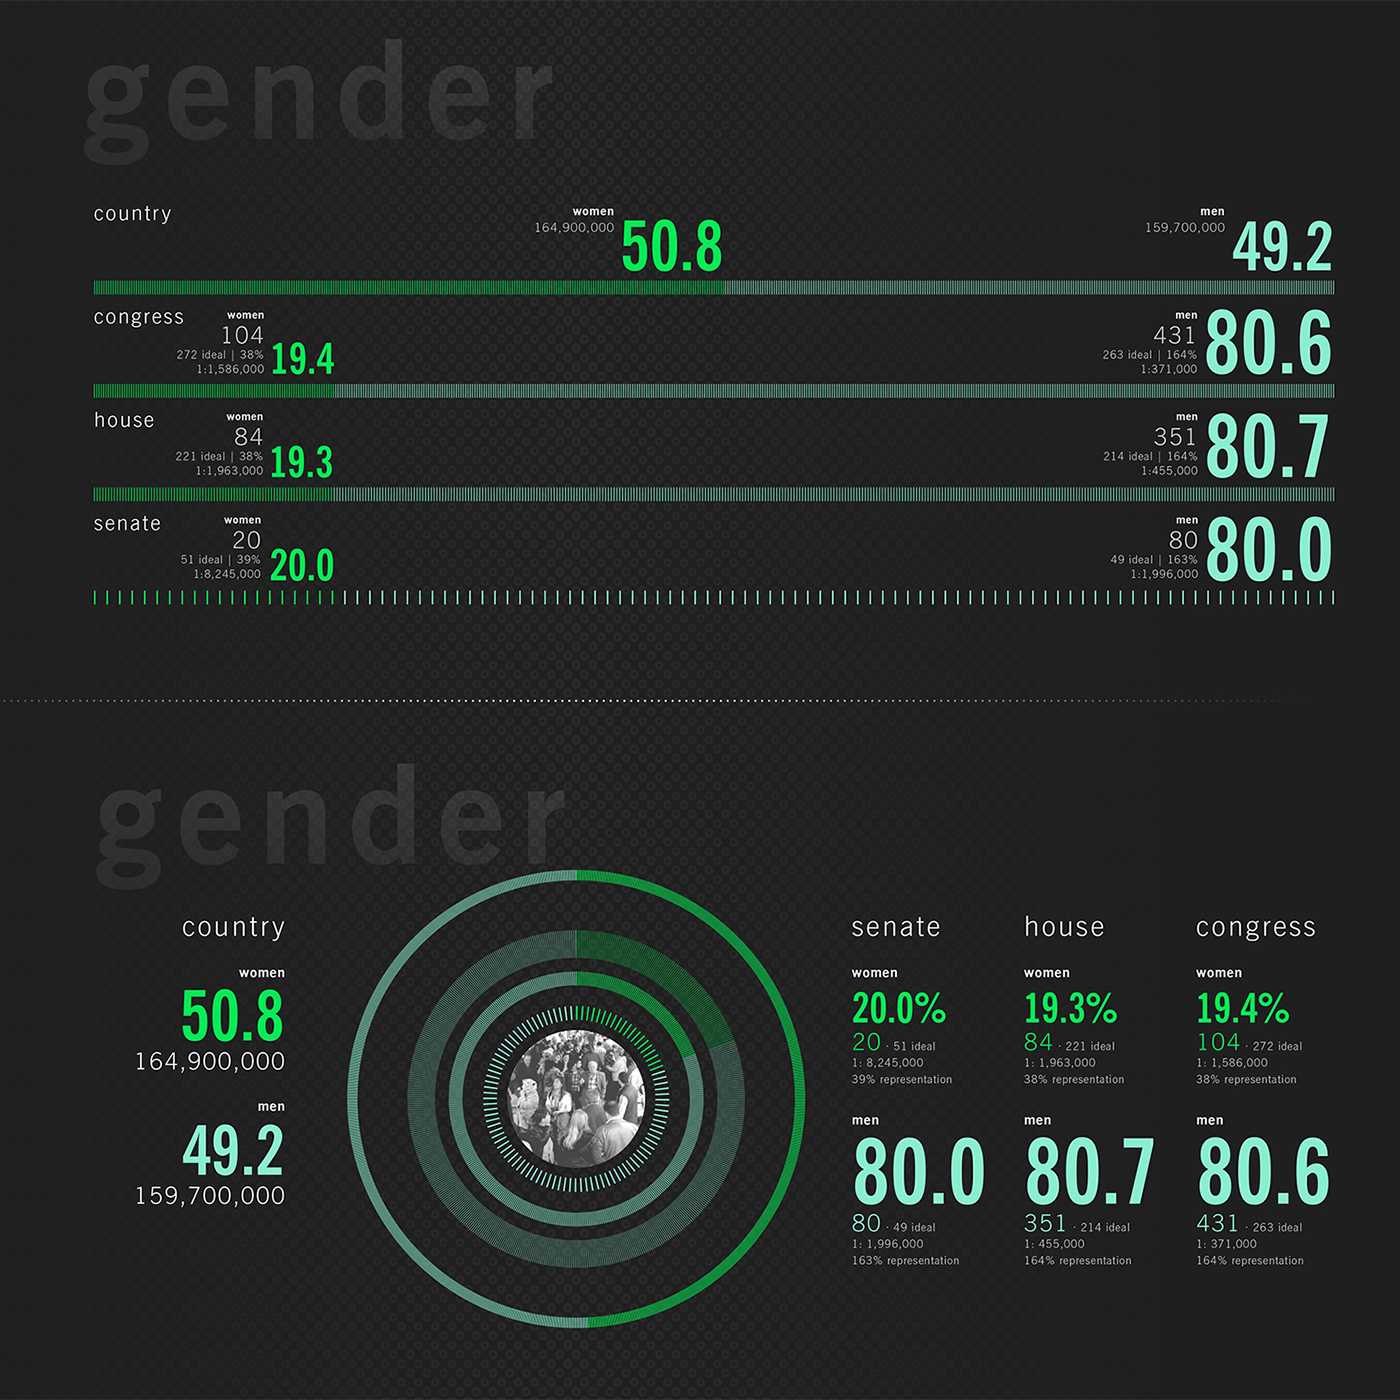
For the mechanics of the infographic, the population is measured in percentages, and Congress by members (varying from 532 to the full voting 535, depending on the date of the study as some vacancies have happened in the past two years). The majority shares in both cases are highlighted by a frame—in many cases, the majorities are the same, though disproportionate, but so often the majorities don’t sync—women are the majority of the nation, but not in Congress, independents and liberals in the nation versus republicans and conservatives in Congress, etc. There are some definite simplifications in the data, as race and religion, for instance, are more complex than a graphic can spell out.
With election day 2016, I took a look at how well represented we are as a nation in terms of demographics. This Congress has been touted as the most diverse yet, but naturally there’s a long way to go. Personally, I don’t think that a congressman has to be your exact demographic in order to represent; however, discussions with people concerning minority issues, I’ve noticed how much it helps to have some minority status in order to have sympathy for those issues. In my own state, I’m part of most majorities—white, male, Mormon and conservative backgrounds, but have some minority identities—gay, single, inactive Mormon, independent to liberal politics, that I’ll find it frustrating that any laws to accommodate more groups are usually met with “things are just fine the way they are” by government and community members who check all the majority boxes.
For the mechanics of the infographic, the population is measured in percentages, and Congress by members (varying from 532 to the full voting 535, depending on the date of the study as some vacancies have happened in the past two years). The majority shares in both cases are highlighted by a frame—in many cases, the majorities are the same, though disproportionate, but so often the majorities don’t sync—women are the majority of the nation, but not in Congress, independents and liberals in the nation versus republicans and conservatives in Congress, etc. There are some definite simplifications in the data, as race and religion, for instance, are more complex than a graphic can spell out.
I found the need to simplify the data from what I originally had, realizing I was trying to relate far too much at once, which just confuses the graphic and diminishes the impact. Also, there are a few categories I would like to have added, but couldn’t because of lack of data or because Congress is uniformly unlike the country—children, home ownership, business ownership, education level, tax burden, insurance coverage, disabilities—maybe these are for a follow up with the 115th Congress to see our representative progress.