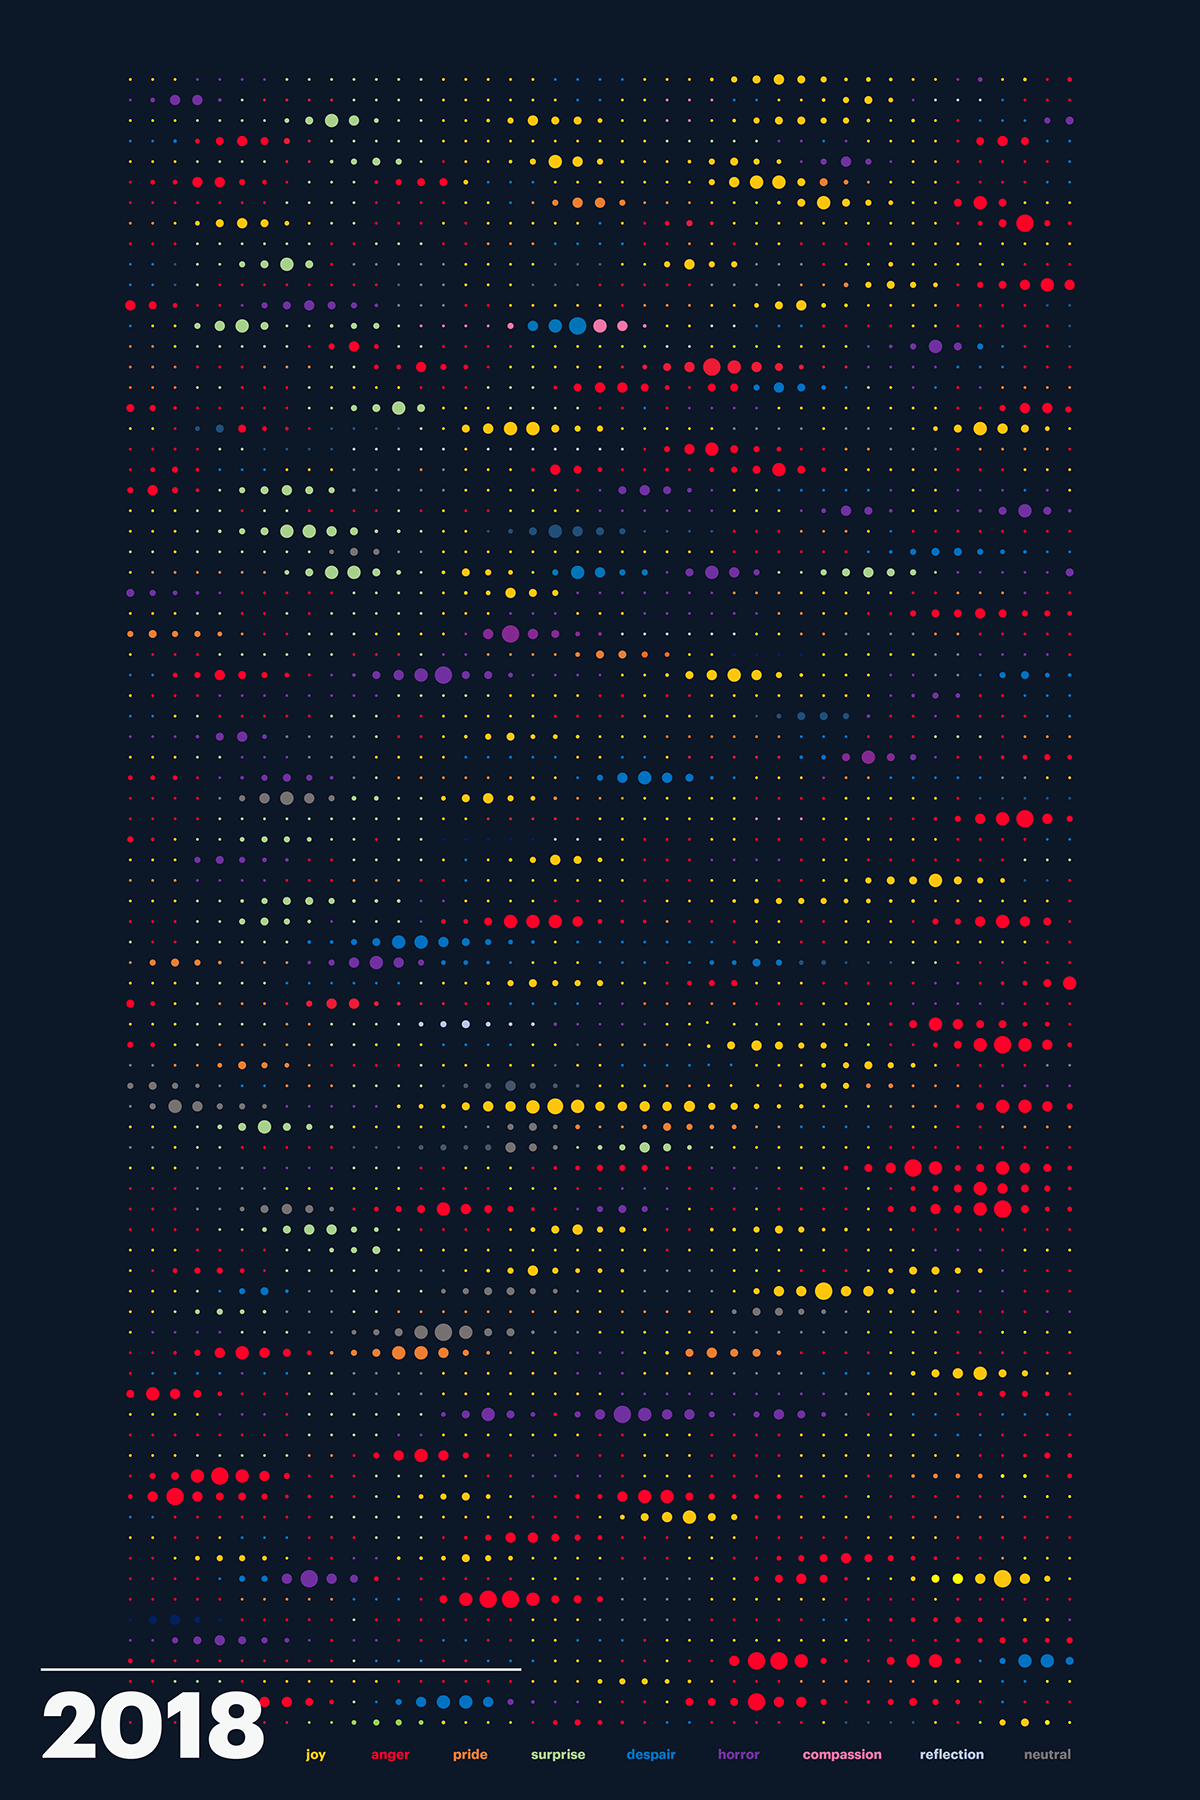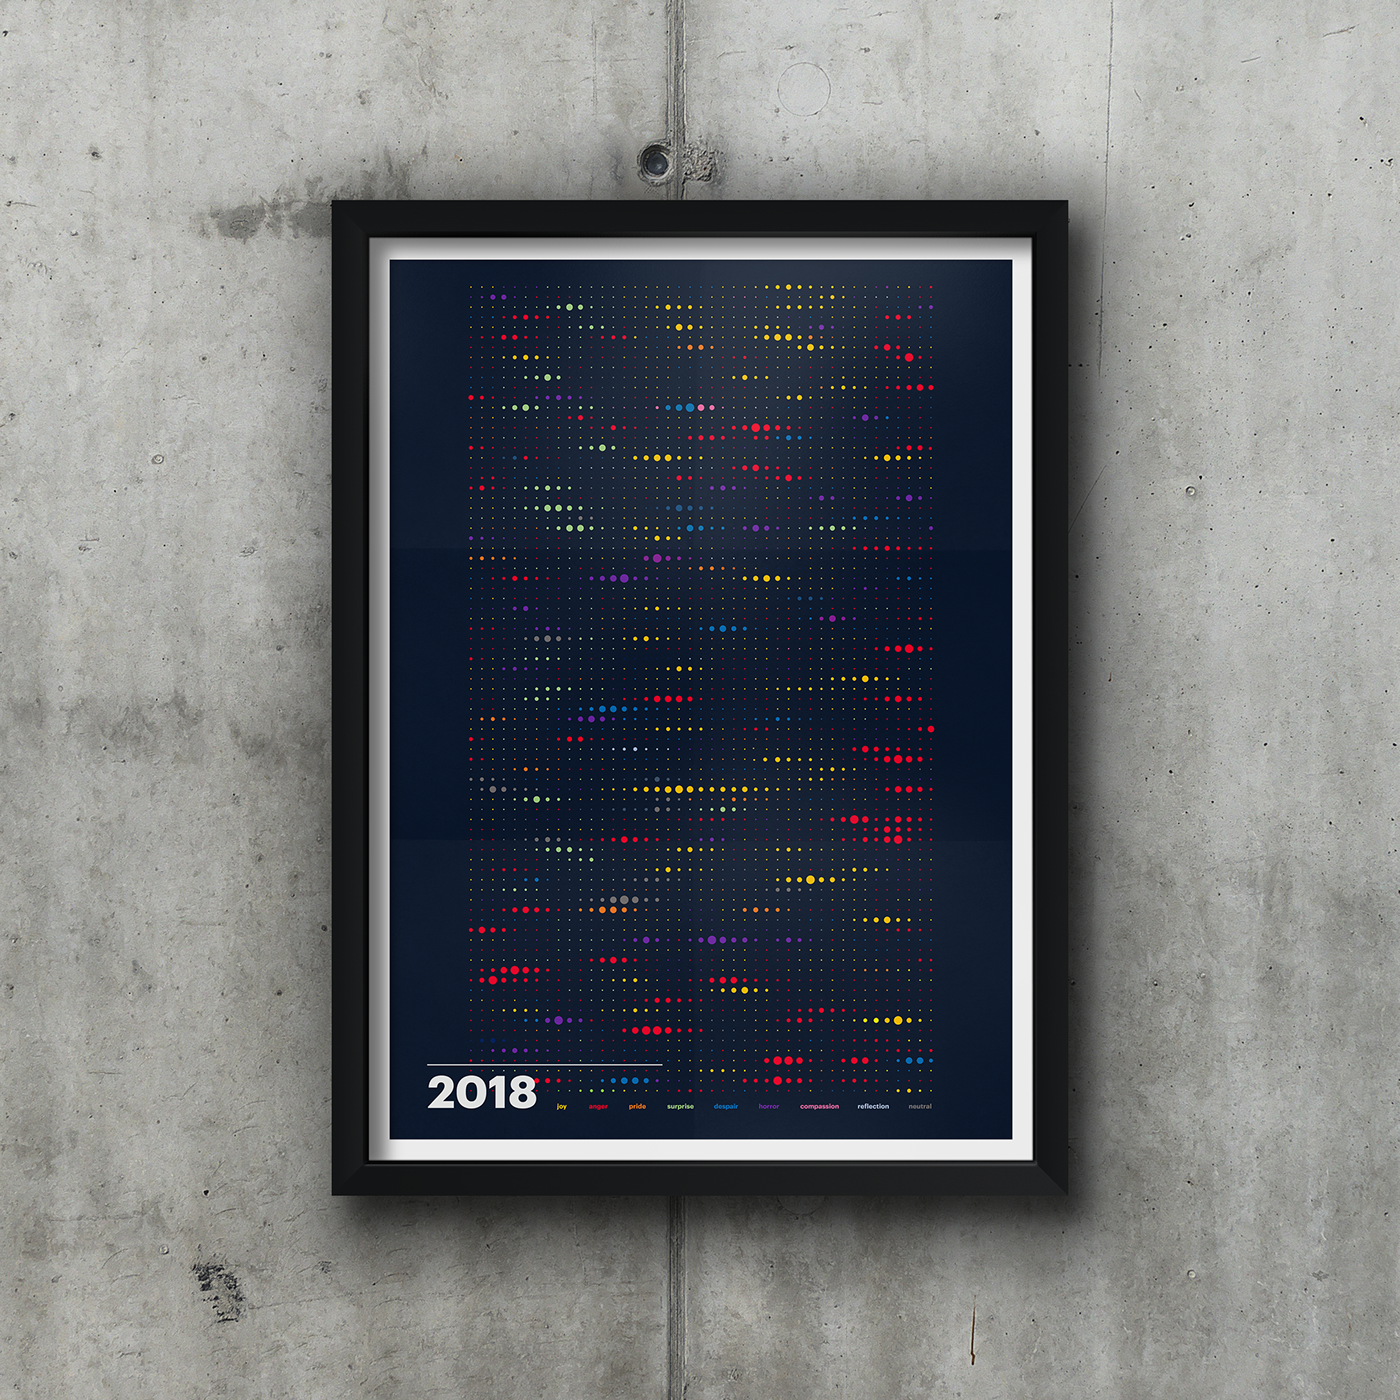

2018 Mood Data Visualization
Project Advisors:
Eric Gunther and Jackie Littman
Eric Gunther and Jackie Littman
This poster was developed over a weekend workshop with Eric Gunther (Sosolimited) and Jackie Littman (Huge) who prompted us to experiment with new ways to visualize data. With a database of every New York Times headline from 2018, I isolated key emotive words and phrases with color, and then abstracted the block of over ten thousand words to bring attention to different points of prolonged emotions or areas of stark contrast throughout the year.